
Tutorial for using MetaQuant
- Compound file: A small compound library containing some compound definitions and calibration information.
- Mix file: This file contains the concentration of all substances in the standard mix. This file is needed for the automatic calibration function of MetaQuant.
- GC/MS Chromatogram for (Auto-)Calibration: 4 µl of the standard mix have been measured using the HP GC/MS (GC: 6890, MS: 5973) device.
- GC/MS Chromatogram for Analysis: Chromatogram displaying GC/MS data of a real bacterial metabolome extract.
First program start: Do some preferences
MetaQuant requires some GC/MS device-dependent preferences for starting. These settings can be adjusted under the "Preferences"-tab in MetaQuant. Enter the following preferences for this tutorial:
- First scan: 6.595
- Scan rate: 163.375
- Peak threshold: 15
- Tailing factor: 5
For a further description of these values refer to the manual of MetaQuant.
Open the compound file
Download the compound file and open it using MetaQuant's  -button. After selecting one of the four compounds by double mouse click the program will display some details for the selected compound. Notice the "Quantifier ions" that are used for quantification.
Then switch to the "Calibration" panel. In the lower right MetaQuant depicts a table for each "quantifier ion" for the selected compound. The rows of the table represent the calibration points. When selecting a row inside a table, the program displays the following details:
- The upper right part of the tab depicts a visualization of the recognized peak. The m/z value depends on the selected table. It's an old chromatogram, but MetaQuant doesn't forget about found peaks!
- The lower left part of MetaQuant calibration panel shows a text box with details of the peak recognition. For example the determined peak area (the result of the integration).
- The upper left part of the tab contains information about the used substance amount (n).
This screenshot of MetaQuant depicts the descibed information for Alanine-2TMS and ion 116 selected:
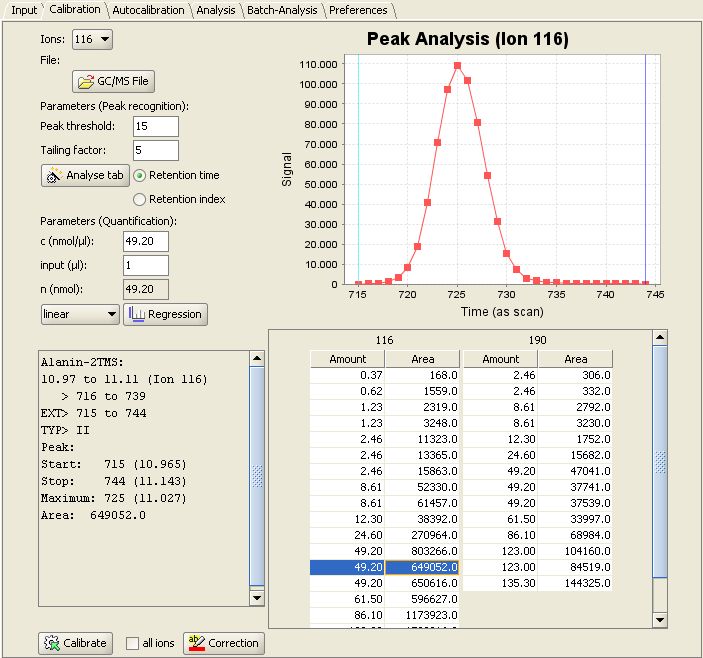
Clicking on the  -button switches the view between table and regression visualization. Aditionally the appropriate regression algorithm can be selected between several regression methods (e. g. in this case linear regression).
Calibration: Add a Calibration
A single Calibration can be performed using the "Calibration" panel. If several metabolites shall be calibrated in parallel, it is necessary to provide a mix of substances with known concentration. This standard mix needs to be defined for using the automatic calibration (Autocalibration) function of the program. Of course, MetaQuant allows the user to save the data of these predefined standard mixes.
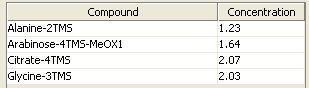
Therefore the downloaded mix file can be loaded using the  -button in "Autocalibration" panel. In this example the standard mix consists of the following concentrations:
To start the automatic calibration MetaQuant needs to load the recorded GC/MS chromatogram of a specific amount of injected standard mix. In this case we recorded the chromatogram for 4 µl of the described standard mix.
The downloaded GC/MS Chromatogram for (Auto-)Calibration can be opened by clicking the  -button and selecting the appropriate file. After entering the amount of analysed standard the calibration can be started by clicking the
  -button.
The new calibration points will be inserted to the table, which can be view in "Calibration" panel. If problems occur during automatic calibration an error log is displayed.
-button.
The new calibration points will be inserted to the table, which can be view in "Calibration" panel. If problems occur during automatic calibration an error log is displayed.
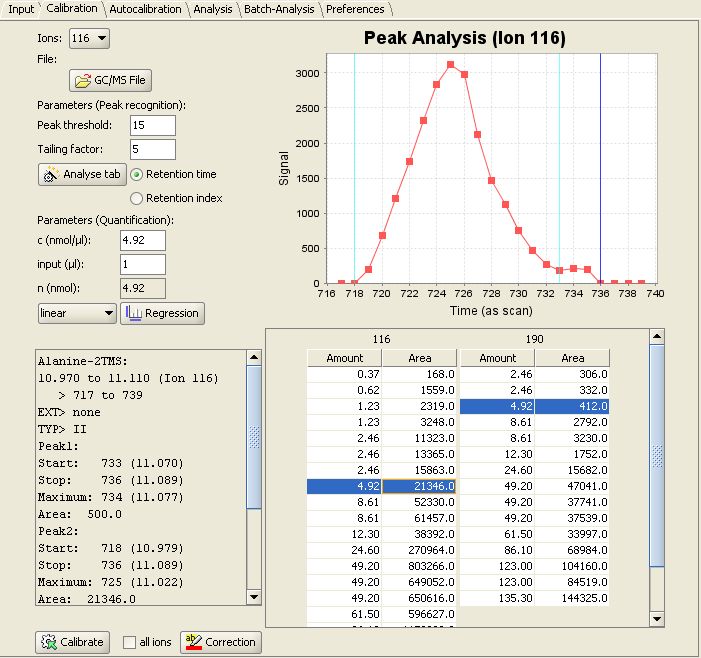
For example we injected 4 µl x 1.23 nmol/µl = 4.92 nmol of Alanin.
The new calibration value are sucessfully added by MetaQuant viewing Alanine-2TMS and ion 116 selected again:
Analysis of a real sample
After good calibration work has been done, you can easily analyse a real sample. Switch to the "Analysis" panel and select the GC/MS-Chromatogram for Analysis as . After a click on  , the chromatogram will be checked for
presence of the compounds. After that, each compound will be quantified.
, the chromatogram will be checked for
presence of the compounds. After that, each compound will be quantified.
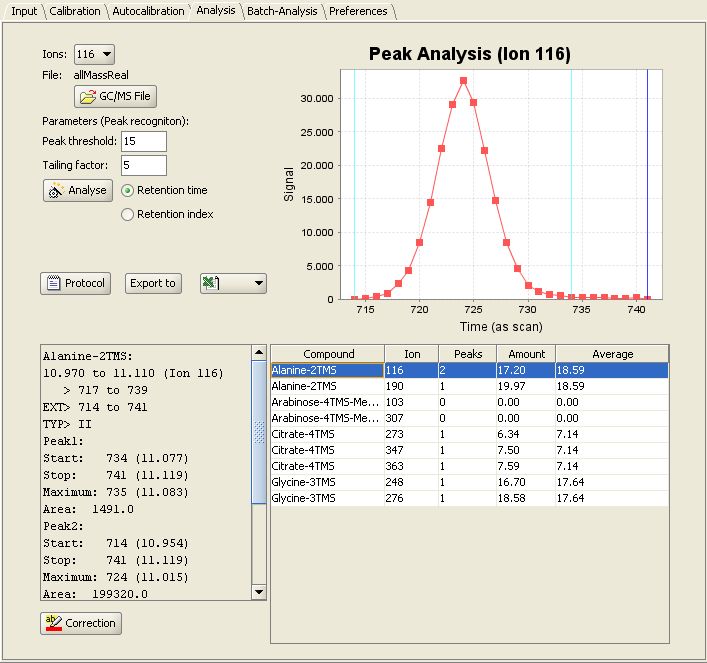
For each result you can review the peaks and the integrated areas. Now you can export your results to Excel, SBML or XML.
Last update: September 4, 2008 by Boyke Bunk