3.1 Consensus map
The first step of the QTL meta-analysis is to intergate all the input genetic marker maps into a single one called the consensus marker map.
3.1.1 InfoMap
3.1.1.1 Method
Before performing the construction of the consensus map, it is important to evaluate how the input maps are connected together. For each linkage group, InfoMap displays some descriptive statistics about the marker maps and for each pair of mapping experiments the program looks for common marker sequences. A common marker sequence is a set of at least two common markers for which the order in the two linkage groups is consistent. The marker order is said to be consistent even if the sequence is completely inverted between the two linkage groups.
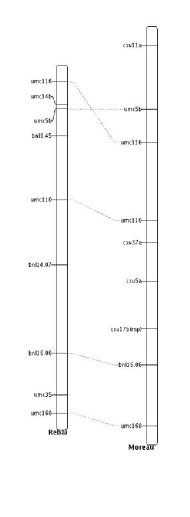
For example, in the above figure the number of common marker sequences is 2. The first one (in red) involved 2 markers (umc116, umc5b), which order is reversed between the two chromosome, and the second one (in blue) involved 3 markers (umc110, bnl16.06, umc168).
3.1.1.2 Command Line Options
| Option | Usage | Type | Explanation
|
|---|
-m,--mapdir | required | string | The directory which contains the XML files.
|
-o,--output | required | string | The output file name.
|
-t,--mrkth | optional | integer | The threshold on the occurence of the markers.
|
For example,
%java org.metaqtl.main.InfoMap -m xmldb -t 2 -o info.txt
gives information on the mapping experiments which XML files are included in the directory xmldb by keeping only markers which are defined in at least 2 mapping experiments.
3.1.1.3 Output
The output of InfoMap is a plain text file. For each linkage group, results are introduced by a '>CR' tag followed by the name of the linkage group as follows:
     >CR 7 Connected=true
     #
     # Table of the chromosomes
     #
     1	Ribaut		12	9.67
     2	Lubberstedt	9	10.34
     3	Moreau		9	15.23
     4	Rebai		9	13.26
     5	Mechin		9	8.78
     #
     # Average number of marker per chrom m=9.60
     # Average interval marker distance=11.45
     #
|
The term `Connected=true' means that it exists a path in terms of common markers from any mapping experiment to any other mapping experiment. Otherwise, the value will be set to `false'. This insures that for this linkage group the consensus map of the chromosome can be build. Then comes a table which summarizes the number of markers and the average interval marker distance per mapping experiment.
It is followed by the table of common markers which gives for each pair of mapping experiments the number of common markers which connects them. It can be viewed as the adjency matrix of the graph which connects the mapping experiments according to the number of common markers they share.
     #
     # Table of the number of common markers
     #
     # Total number of marker M=37
     # Prop of common markers p=0.1650793650793651
     #
     Chrom		Index	1	2	3	4	5	Total
     Ribaut		1				1.0		1.0
     Lubberstedt	2			1.0	2.0	1.0	4.0
     Moreau		3		1.0		5.0	2.0	8.0
     Rebai		4	1.0	2.0	5.0		3.0	11.0
     Mechin		5		1.0	2.0	3.0		6.0
|
The two last tables are based on the common marker sequences found for each pair of mapping experiments.
     #
     # Table of the number of common sequences
     #
     Chrom		Index	1	2	3	4	5
     Ribaut		1
     Lubberstedt	2				1.0
     Moreau		3				2.0	1.0
     Rebai		4		1.0	2.0		1.0
     Mechin		5			1.0	1.0

     #
     # Table of proportion of marker involved in common sequences
     # The value can be negative depending on the frame of the
     # common sequences
     #
     Chrom		Index	1	2	3	4	5
     Ribaut		1
     Lubberstedt	2				1.0
     Moreau		3				0.2	1.0
     Rebai		4		1.0	0.2		1.0
     Mechin		5			1.0	1.0
|
In this example, the first table reveals that the mapping experiment “Moreau” and “Rebai” show marker order inconsistency since there are 2 common marker sequences between them. In the second table the proportion of common markers involved in the common marker sequences are reported. This proportion is obtained by summing the number of markers of the common sequences weighted by 1 if the order is the same, -1 otherwise, and dividing this quantity by the total number of common markers. This value lies between -1 and 1. A value of 1 indicates that all the common markers are correclty ordered between the mapping experiments meanwhile a value of -1 indicates that the common marker order is completely reversed between the two mapping experiments. For example, in the above figure the two maps share 5 common markers: 2 are involved in a common sequence which is inverted, and 3 in a common sequence in the same way. Then the proportion of markers involved in common sequences is (3 x 1 + 2 x (-1))/5 = 0.2.
3.1.2 ConsMap
ConsMap is dedicated to the construction of consensus marker map.
3.1.2.1 Method
The method implemented in MetaQTL is based on a Weigthed Least Square (WLS) strategy. Contrary to iterative projection procedure, this method makes it possible to integrate all maps in a single step. It is also possible to fix a genetic map as reference.
3.1.2.2 Command Line Options
| Option | Usage | Type | Explanation
|
|---|
-m,--mapdir | required | string | The directory which contains the XML files.
|
-o,--outstem | required | string | The output file stem.
|
-r,--refmap | optional | string | The XML file of the reference map.
|
-t,--mrkthresh | optional | integer | The threshold on the occurence of the markers.
|
-d,--dubfile | optional | string | The file containg a list of markers to ignore.
|
--mrkdico | optional | string | The marker dictionary.
|
For example,
     %java org.metaqtl.main.ConsMap \
     >     -m xmldb -r xmldb/IBM.xml -o consmap
|
builds a consensus linkage map using all the maps in the directory xmldb fixing the map defined in xmldb/IBM.xml as the reference.
3.1.3 Output
The result of ConsMap consists in two files:
- <output_stem>_map.xml : a XML file which represents the consensus map.
- <output_stem>_fit.txt : a plain text file which gives for each chromosome the goodness-of-fit and the standardized residuals between the input maps and the consensus one. Each line begins with an identifier composed by 2 characters followed by its corresponding value.
| Identifier | Value
|
|---|
| CR | The name of the linkage group.
|
| NM | The number of distinct markers positioned on the consensus linkage group.
|
| GF | The goodness-of-fit of the consensus linkage group.
|
| PV | The p-value associated to the goodness-of-fit.
|
| DF | The number of degree of freedoms of the residual.
|
| SR | The standardized residuals: first comes the name of the mapping experiment followed by the value of the residual. These values are ordered according to the order of the marker intervals in the linkage group of the mapping experiment.
|
For example, this file can look like this:
          CR 7
          NM 37
          GF 182.0738940381568
          PV 1.0
          DF 7
          SR Lubberstedt 1.6308530669014496E-13
          SR Lubberstedt -9.205700855506115E-14
          SR Lubberstedt -3.401706740747478E-14
          SR Lubberstedt -1.049889614734477E-13
          SR Lubberstedt 1.2471027908772377E-13
          SR Lubberstedt -2.9725343354129593E-13
          SR Mechin -4.797069139413729E-15
          SR Mechin 5.484351947823543E-14
          SR Mechin 6.830428378396427E-15
          SR Mechin 0.7995364207820779
          SR Mechin 0.3047608429054208
          SR Mechin -6.98290111003849E-14
          SR Moreau 9.661620158868837E-15
          SR Moreau 10.85507243048007
          SR Moreau -2.1096760232982783
          SR Moreau -0.002216097065843051
          ...
|