Previous: MMapView, Up: Visualization
MQTLView is designed to depict the result of the QTL clustering for one or several chromosomes on a given map.
| Option | Usage | Type | Explanation
|
|---|---|---|---|
-m,--map | required | string | The XML file for the genetic map.
|
-c,--chrom | required | string | The name of the chromosome (or a list separated by comma) to display.
|
-o,--output | required | string | The output file stem.
|
-r,--clust | optional | string | The file of the clustering result.
|
-b,--best | optional | string | The file of the best clustering (only with -c).
|
-t,--tree | optional | string | The file of the hierarchical clustering result.
|
--mode | optional | integer | The mode of representation (0 or 1 and only with -c and -b)
|
--trait | optional | string | The name of the trait.
|
-p,--parfile | optional | string | The drawing parameter file.
|
--img | optional | string | The format of the image (use –help for possible values).
|
MQTLView provides several ways to represent the results of the QTL clustering depending on the algorithm used to perform it. Suppose we have first done a clustering using QTLClust See QTLClust, which produced the result file clust_res.txt. From the output file clust_model.txt generated by QTLClust we have derived the file clust_best.txt which gives for a given trait the best clustering model for each chromosome (according to a given model choice criterion):
|
|
--mode 1 which leads to something like that
Now, if you set the option --mode to `0', i.e
|
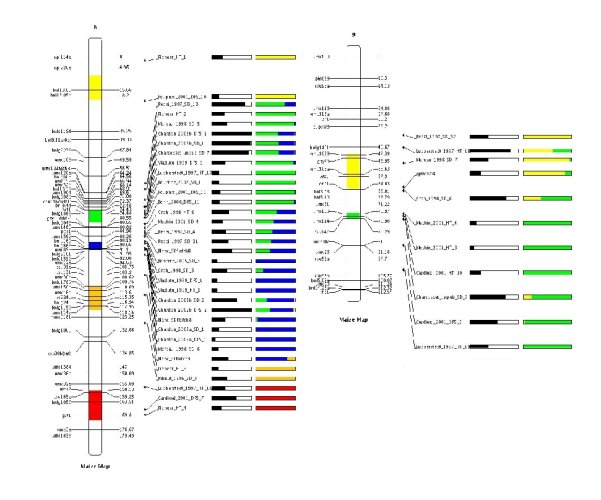
where the first bar which follows the name of the QTL corresponds to the relative CI of the QTL (i.e. that the more the bar is filled, the larger the CI is). The second bar gives the membership probabilities of the QTL according to the meta-QTL model.
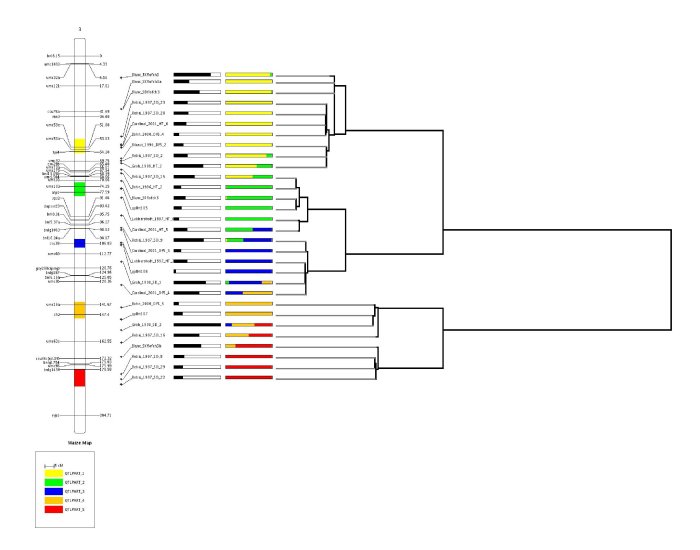
If the clustering have been done via QTLTree, the result file obtained tree.txt can be passed to MQTLView as follows,
|
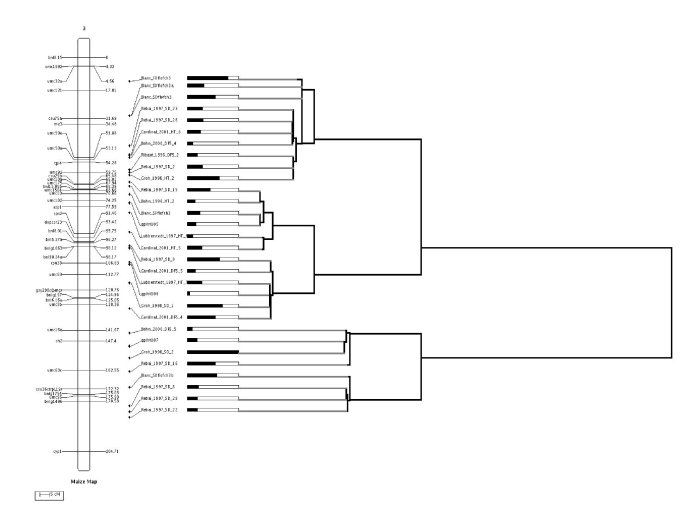
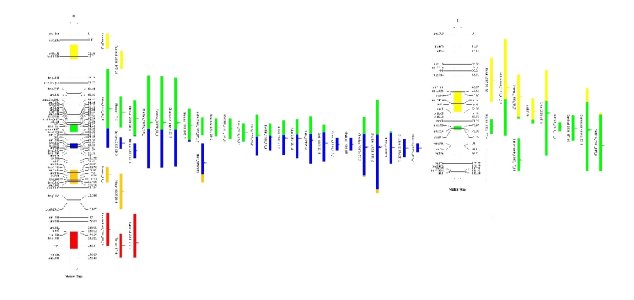
Finally the results from QTLClust and QTLTree can be visualized together as shown bellow.
|