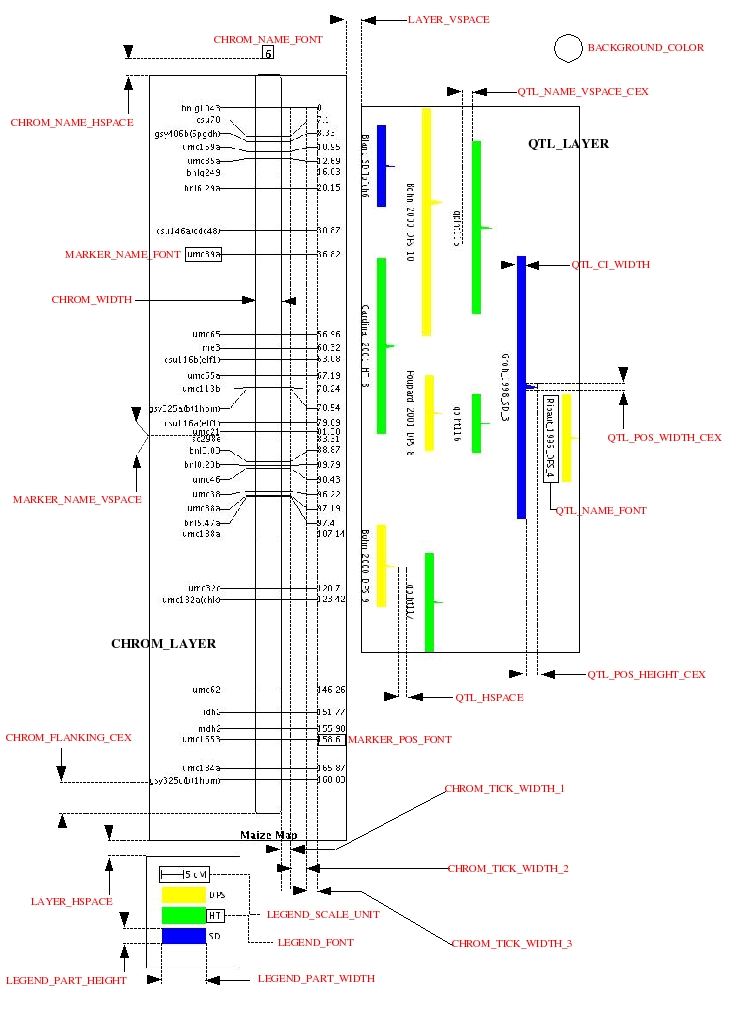
Figure 4.1: Details of formatting parameters for MapView.
Next: MMapView, Up: Visualization
MapView is designed to draw markers and QTL for one or several linkage groups, depending on drawing parameters.
| Option | Usage | Type | Explanation
|
|---|---|---|---|
-m,--mapfile | required | string | The XML file for the genetic map.
|
-c,--chrom | required | string | The name of the chromosome(s) to display.
|
-o,--output | required | string | The output file stem.
|
-q,--withqtl | optional | integer | Draw also QTL.
|
-t,--tonto | optional | string | The XML file for the trait ontology
|
-p,--parfile | optional | string | The drawing parameter file.
|
--qmode | optional | integer | QTL representation mode (0=bar,1=arrow)
|
--tree | optional | string | a QTL tree (obtained with QTLTree);
|
--img | optional | string | The format of the image (use –help for possible values).
|
|
-p or --par option
|
Several parameters allow user to put in form the figure. The next figure illustrates the role of each parameter.
The paremeter file is organized as follows:
|
#' is ignored by the program. Each drawing parameter is specified by its own name directly followed by a sign `=' and its value. For the parameters which specify a color (those which end by `_COLOR') the value must be a RGB code in hexadecimal (e.g red is ff0000, green 00ff00, blue 0000ff, white ffffff, black 000000, and etc...). For the parameters which specify a font (those which end by `_FONT') the value must be a string composed by 3 tokens separated by a `:'. The first token gives the name of the font, the second one the style of the font (among `PLAIN,BOLD' and `ITALIC') and the last one indicates the size of the font. The parameter file generated by MapView ends by a list of the available fonts on your system. If you do not use a font name in this list, then MapView will use the default font.
The parameters which start by `WITH_' allow the user to specify if the corresponding elements of the figure must be drawn. The possible values for these parameters are either `true' (draw) and `false' (not to draw). For example if you set `WITH_MARKER_POSITION=false' the marker positions along the chromosome wont' be drawn.
When the QTL are added to the figure (option -q with MapView) they are colored according to their trait group. The colors used to display the QTL are also specified in the parameter file generated by the program. For example, let's assume that the QTL belongs to 3 trait groups. The parameter file will then contain the following lines:
|
QTL_COLOR_i is the color of the group i. You can use these lines to modify the default colors.