User Tools
Table of Contents
SEQPower Output
Output Contents
Two types of output are generated in power calculation process: association group statistics as well as summary site specific attributes.
- Association group statistics: summary statistic for the group of variants on which power analysis was carried out, including power or required sample size, cumulative MAF (by case control group, by functionality categories), data properties (missing / error genotype call rates), etc.
- Site specific attributes summary: attributes of each variant sites within the group, including MAF, function score, etc, from input data, and model specific attributes such as odds ratio, population attributable risk, MAF in cases/ctrls for each variant site, etc.
Output Format
Output are written to two separate .csv files and to a SQLite database. The .csv output will be overwritten each time the program is executed, yet the results in database will be updated with the latest calculation while keeping all existing information it has. The .csv can be considered as an intermediate output to readily view current calculation results. The database contains all calculations ever performed, which serves as useful resource for future references.
Extract information from output files
spower show command provides features to extract information from output text or database files.
Text file
For example,
spower show test.csv
shows all column names in the output file test.csv. To view values of particular columns, for example “method” and “power”:
spower show test.csv method power
Wildcard character “*” is supported, for example:
spower show test.csv *deleterious*
Database file
For example
spower show test.SEQPower.DB
shows all table names in the database, e.g.,
To show column names in a particular table:
spower show test.SEQPowerDB LOGIT
To show values for a particular column for a table:
spower show test.SEQPowerDB LOGIT power
Note that wildcard character is not supported for database output. However an additional --condition command is supported for database. For example to select only the tests having power greater than 0.8:
spower show test.SEQPowerDB LOGIT title method power --condition "where power > 0.8"
Graphical interface for SEQPower databases
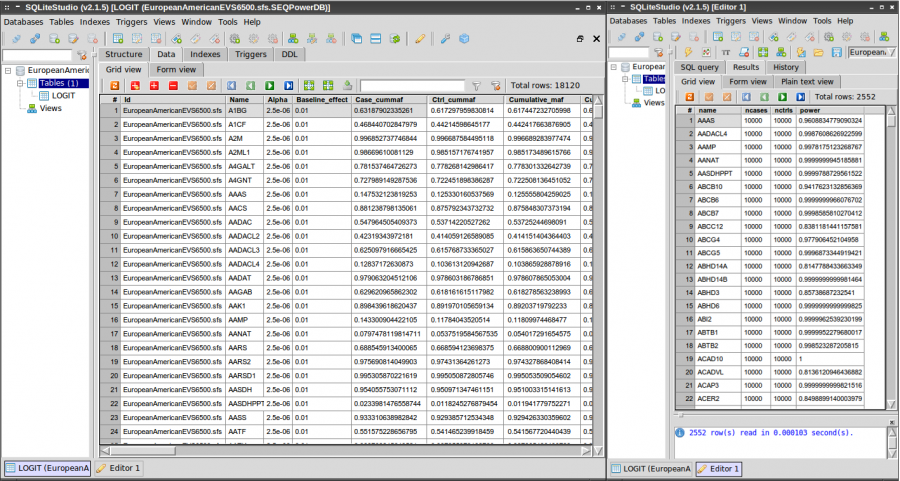
We recommend the use of an SQLite GUI software such as SQLite Studio to browse the result SQLite database. These programs display the data as spreadsheets, and provides simple “click & run” features to filter or query the current database.
Below is a screen shot of SQLite Studio displaying the power analysis result of a whole exome scan (left) and the tests with power greater than 80% (right), extracted via running SQLite query from the GUI.
