[Chapter 1:Chapter 2:Chapter 4:Chapter 5:Chapter 6][Top]
| E-CELL2 User's Manual | Chapter 3 Basic Operation [Chapter 1:Chapter 2:Chapter 4:Chapter 5:Chapter 6][Top] |
In this chapter, the basic operation of the E-CELL2 System will be explained. It will be assumed that users have already mastered the overall operating procedures for E-CELL2, which have been explained in "Chapter 2 Tutorial". Please refer to Chapter 2 if necessary. Two modes, a GUI mode and a batch mode, exist in E-CELL2. In this chapter, most of the explanations will be on the former mode(GUI mode). In "Section 2 Basic Operation", the startup and shutdown of the E-CELL2 System in GUI mode will be explained briefly first. Operations in batch mode will be explained in "Section 2.9 E-CELL2 Batch Mode and Loggers". Loggers, newly implemented for the E-CELL2 System, are mechanisms that continuously save simulation results in real-time. Details of the operation procedures will be explained in "Section 3 Interfaces". Script files, which improve the operation of E-CELL2, will be explained in detail in "Section 4 E-CELL2 Script Files".
The E-CELL2 System requires data files called rule files for running simulations. Rule files will be explained in Chapter 4. Also, to create new models, new Reactors need to be constructed. Reactors will be explained in detail in Chapter 5. After reading through these chapters, one should be able conduct basic modeling using the E-CELL2 System. Please note that the guaranteed accuracy of calculation for GUI mode and batch mode is different; it is 64 bits and 80 bits respectively.
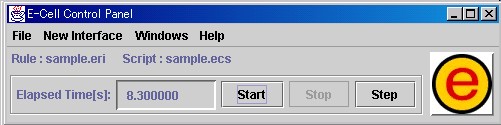
After the E-CELL2 System starts, the E-CELL2 ControlPanel will first displayed first.
If a script file called "default.ecs" is located under the E-CELL2 startup directory (The model directories under C\:E-CELL2, in a standard install), the file will automatically be loaded. However, please note that if the "LoadRule" command does not exist in the script file, while the "NewInterface" command or the "Run" command does exist, an error will occur and the file will be non-executable. The details regarding script files are explained in Section 4 of this chapter.
It is also possible to load settings with the file by adding options when directly starting ECELL2.BAT from the command line. The options are shown below.
| -a classname | Designates the default Accumulator class (Refer to Chapter 4). |
| -c | If this option is designated, and if a cell state file is loaded when the simulation elapsed time is 0, the simulation elapsed time recorded in the cell state file will be set to the present simulation progress time. In all other cases, the simulation progress time will not change even if a cell state file is loaded. For details regarding cell state files, please refer to Section 2.7 in this chapter. |
| -d | Starts in debug mode. |
| -f filename.ecs | Loads the designated scriptfile. |
| -h | Displays a list of options. |
| -t directory_name | Designates the target directory for writing the temporary files. |
| -u integer_value | Designates the number of times Postern Reactors are called at the time of initialization. For details, please refer to the explanation of Postern Reactors in Chapter 5. |
Rule(eri) files, which are data files describing information that is necessary for the E-CELL2 System to run simulations, must be loaded prior to executing simulation. To load Rule(eri) files, please select [Load Rule] from the [File] menu in the ControlPanel, and then select the appropriate Rule(eri)file from the newly displayed FileSelector window.
Please note that if Rule files are loaded more than 2 times, E-CELL2 will display an error message.
If a file called "default.ecs" is located under the E-CELL2 startup directory, the file will automatically be loaded at the time of startup. Please note that if an error occurs during the loading process, there is a possibility that E-CELL2 will abnormally shut down.
Script(ecs)files are files for controlling and automating simulation and interfaces. Script(ecs)files need not be loaded. To load a Script file, please select [Load Script] from the [File] menu in the ControlPanel, and then select the appropriate Script(ecs)file from the newly displayed FileSelector window.
Please refer to the startup option "-c".
If the "Start" button in the ControlPanel is clicked after loading a rule file, the time progress within the simulation system will be displayed in the time counter. To stop simulation, please press the "Stop" button. Also, if the "Step" button next to the "Stop" button is clicked, a single time step-worth of simulation will be executed.
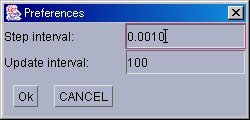
A step refers to a single cycle that first calculates the rates of reactions, and then updates the quantities of the affected Substances. At default, the size of an integration time step is 1/1000 seconds. To change the size of this time step, please select [PreferenceWindow] from the [Windows] menu in the ControlPanel, and then input a numerical value in the text box that will be displayed. This can also be designated using ecs files.
If the step size is increased, the time necessary for simulation will be shorter, but will result in an increase in error. On the other hand, if the step size is decreased, the time necessary for simulation will be longer, but will result in a decrease in error.
In the default settings, user interfaces are updated once every 100 integration calculations. This interval can be changed in the ecs file.
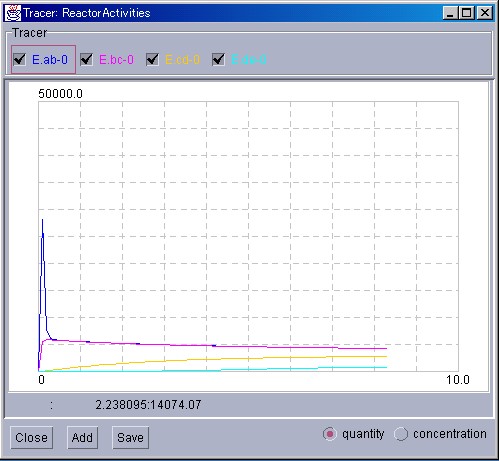
Tracers display the simulation results as a 2-dimensional graph. In the vertical axis, the changes in the quantity/concentration of Substances, or the changes in the activity of Reactors are displayed. In the horizontal axis on the other hand, the time is displayed. To display a new TracerWindow, please select [Tracer] from the [NewInterface] in the ControlPanel. To display a new Substance or Reactor in the Tracer, please click on the "Add" button at the bottom. An EntrySelector will then be displayed. Please select the appropriate Substance or Reactor.
Please note that what Substances describe does not necessarily refer to "molecules" of strict chemical terminology. It may be voluntary particles such as ions and radicals. However, in this manual we will use the term "molecule" for convenience.
The selected Substances and Reactors will be displayed with the colored square checkboxes in the Traces display area. If simulation starts in this state, the state of the Substance or Reactor will be represented by a graph of the same color as the square next to the checkbox.
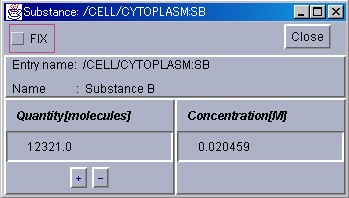
To display or change the quantities of substances, SubstanceWindows are used. To display a SubstanceWindow, please select [SubstanceWindow] from the [NewInterface] menu in the ControlPanel. An EntrySelector will then be displayed. Please select the appropriate Substance. If the "OK" button is clicked, a SubstanceWindow will be displayed.
In the SubstanceWindow, the ID and the substance name are displayed from the top. Below this, the number of molecules is displayed on the left, and the concentration on the right. If simulation is in a stopped state, these two values can be directly changed. After clicking on the displayed values to be changed and inputting new numbers, please press the return key to actually change the values. The number of molecules can be changed also by using the up and down buttons on the bottom.
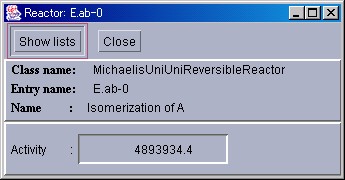
To observe the rates of reactions, and the substrates and products that are involved, ReactorWindows are used. To display a ReactorWindow, please select [ReactorWindow] from the [NewInterface] menu in the ControlPanel. An EntrySelector will then be displayed. Please select the appropriate Reactor. If the "OK" button is clicked, a ReactorWindow will be displayed.
In the ReactorWindow, the Reactor class, entry name, and the name of the reaction will be displayed from the top. Below these, the activity per second will be displayed.
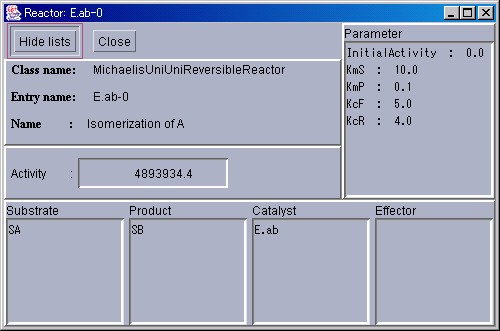
This is in a simple display mode. To observe the substrates and products involved in the reaction, please click the "ShowList" button on the top left. A new display area will then be added to the bottom. Starting from the left, the list of substrates, products, enzymes, and effectors will be displayed.
To save the simulation results displayed in Tracers, please click the "Save" button on the bottom left corner of the TracerWindow. A directory called "Data" will be created under the directory that the E-CELL2 System has been executed. In addition, subdirectories will be created according to the structure of the System. Also, data files in ecd format will be created for each Substance or Reactor. A data file in ecd format is usually composed of a header, more than 5 "-"(dashes) lined up that represent the end of the header, the data body, and "///"(3 slashes) that represent the end of the file. What has been improved compared to E-CELL1 is that the time, instantaneous quantity, average quantity, maximum quantity, minimum quantity, instantaneous concentration, average concentration, maximum concentration, and minimum concentration can now be outputted in E-CELL2.
| key word | value |
|---|---|
DATA | name of data |
SIZE | number of columns and rows |
LABEL | legend of each column |
NOTE | optional comments |
Example of an ecd file for E-CELL2
DATA: /CELL/CYTOPLASM:E.ab-0:Quantity
DATA: /CELL/CYTOPLASM:P:Quantity
SIZE: 5 102
LABEL: time current-quantity mean-quantity max-quantity min-quantity
NOTE:

----------------------
0       0       0       0       0
0.100000000000000064    624     314.66  624     6
0.20000000000000016     1247    938.65  1247    630
0.300000000000000192    1871    1562.5  1871    1254
0.40000000000000032     2495    2186.19 2495    1877
0.50000000000000032     3118    2809.73999999999968     3118    2501
0.600000000000000384    3742    3433.15 3742    3125
0.700000000000000512    4365    4056.4  4365    3748
0.80000000000000064     4988    4679.5  4988    4371
0.90000000000000064     5611    5302.47999999999936     5611    4994
1.00000000000000064     6234    5925.27 6234    5617
1.0999999999999896      6856    6547.95 6856    6240
1.19999999999997856     7479    7170.48 7479    6862
1.29999999999996768     8101    7792.86 8101    7485
(Omission)
///
To suspend simulation and save the states of the substances for the whole model, please select [Save Cell State] from the [File] menu in the ControlPanel. Please save the file with an appropriate name, with the ".cs" extension. The states of the models saved here can be loaded by selecting [Load Cell State] from the same [File] menu. Simulations can thus be resumed from the states that have been saved.
If [Quit] is selected from the [File] menu in the ControlPanel, a confirmation dialog will be displayed. If the "OK" button is clicked, the E-CELL2 System will shut down.
E-CELL2 provides a batch mode that is executable from command lines. Please start the command prompt(MS-DOS prompt), and then move to the directory that E-CELL2 has been install to. In a standard install, "C:\E-CELL2\standard" is the location of the startup batch of E-CELL2 for the standard reactor model. The E-CELL2 startup batches for each model are located in "C:\E-CELL\model name".
If "ECELL2BB.BAT -h" is typed, a list of the options will be displayed. The options are the same as in GUI mode(Please refer to Section 2.1). ECELL2BB.BAT is the batch file for MS-DOS, and describes the PATH of the directory that the dynamically linked Reactor libraries(DLL) are housed in. In PATH, the designation of a DLL-housing folder(e.g. DLLRB) for batch mode is necessary. To execute simulation in batch mode, it is necessary to include the "-f" option when loading the script file(ecs). If simply typed "ECELL2BB.BAT", it will load "default.ecs". For details on script files, please refer to Section 4 in this chapter.
ECELL2BB.BAT -f filename.ecs
The following are the contents of ECELL2BB.BAT.
| SET PATHSAV=%PATH% PATH=../BIN/WIN-BCC;DLLRB;%PATH% ecell2b.exe -r DLLRB %1 %2 %3 %4 %5 %6 %7 %8 %9 PATH=%PATHSAV% |
If the "Logger" mechanism implemented from E-CELL2 is used, it is possible to record the cell state continuously during simulation. This function was implemented for use in batch mode. For details on its usage, please refer to "Section 4.5 List of Script File Commands".
The ControlPanel, which is the main interface for the E-CELL2 System, is used for operation of tasks such as reading and writing files, operating on other interfaces, and executing and stopping simulation.
If a rule file is loaded, the name of the loaded rule file will be displayed after the "Rule:" under the menu. If a script file is loaded, "Script:" and the script file name will be displayed following the rule file.
|
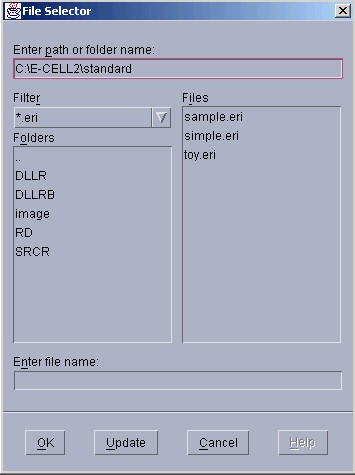
FileSelector windows are displayed for selecting files when reading or writing files. Files can usually be selected by first clicking the directory name until the file display area becomes the appropriate directory, and then by clicking the appropriate file and the "OK" button on the bottom. To write in a new file, please click on the file name display area, then directly input the file name and click on the "OK" button.
Tracers display the quantity of Substances or the activity of Reactors, using 2-dimensional graphs. Up to 8 series of data can be displayed in a single Tracer window.

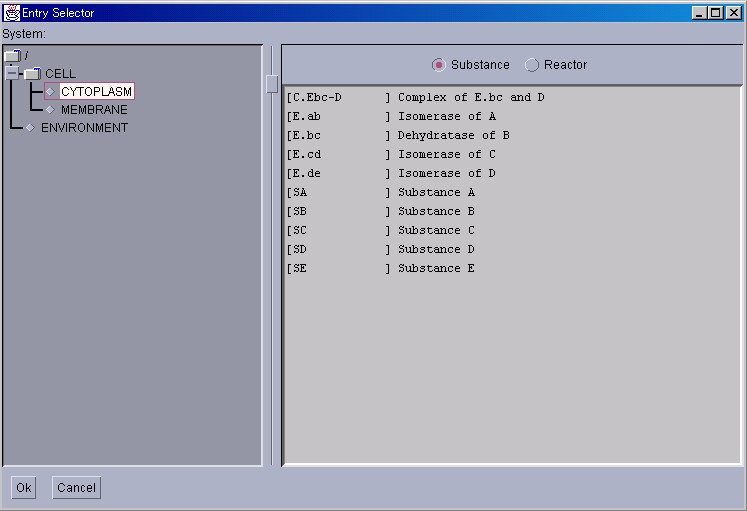
EntrySelectors are used when selecting Substances or Reactors. Please click on the folder icon in the System selection dialog on the left. If the appropriate System has been displayed, please select the appropriate items from the Substance and Reactor selection dialog, and then click on the "OK" button on the bottom. By using the switch button on the top right, what is selected by the Tracers(Substance or Reactor), can be selected beforehand.
Script files are files for batch-processing the startup and shutdown of the E-CELL2 System, the control of simulation such as the recording of its results, and the control of its interfaces that display results.
Script files are text files, and can therefore be created using normal text editors.
Script files are loaded one line at a time, from the top. In script files, one command is described per line, except for the NewInterface command. The insertion of a new line in a single command is not allowed. To declare a command inside a NewInterface such as AddTrace, please describe it directly under the NewInterface command that it belongs to, inserting a space or a tab at the beginning of each line.
The text between the "#" symbol until the end of the line are comments that will be ignored.
A sample script file is shown below.
TmpDir C:\E-CELL2\temp LoadRule sample.eri NewInterface Tracer trace1 AddTrace Substance:/CELL/CYTOPLASM:A AddTrace Reactor:/CELL/CYTOPLASM:R1 SaveAt 45 NewInterface SubstanceWindow test-sw Substance /CELL/CYTOPLASM:A Run 500 Stop |
There have been a few changes made from the E-CELL1 System. What indicates the path of the Reactors, is included in the startup batch file ECELL2.BAT or ECELL2BB.BAT. It has been made to describe the PATH when loading. Therefore, the "ReactorPath" command cannot be used.
TmpDir is a directory for saving temporary files. If the command does not exist, the "temp" directory under E-CELL2's installation directory is used. If the directory designated for TmpDir does not exist, the E-CELL2 System will terminate when executing simulation.
The first line designates the target location for writing the temporary files, whereas the second line designates the rule file to be loaded.
Lines 4 to 7 display a TracerWindow called Trace1, and are carry out a few settings. Line 5 designates the addition of a Substance called A to the Tracer, whereas line 6 designates the addition of a Reactor called R1. Line 7 designates the saving of the state of the Tracer after 45 seconds.
Lines 9 and 10 open a SubstanceWindow.
Line 12 designates the execution of simulation for 500 seconds, whereas line 13 designates the termination of the simulation.
|
||||||||||||||||||||||||||
|
||||||
|
||||||||
|
||||||
|
||||||
|
||||||
| E-CELL2 User's Manual Last Update $Date: 2003/3/18 $. Copyright: Keio University and Mitsui Knowledge Industry Co., Ltd. 2000-2003 | Chapter 3 Basic Operation [Chapter 1:Chapter 2:Chapter 4:Chapter 5:Chapter 6][Top] |