[Chapter 1:Chapter 3:Chapter 4:Chapter 5:Chapter 6][Top]
| E-CELL2 User's Manual | Chapter 2 Tutorial [Chapter 1:Chapter 3:Chapter 4:Chapter 5:Chapter 6][Top] |
In this chapter, the features and operation methods of E-CELL2.26 will be outlined. For details regarding the theoretical background of E-CELL, please refer to the tutorial available at E-CELL.Org(http://www.e-cell.org).
To model a cell, the abstraction of its components is necessary. In E-CELL, the "Substance-Reactor Model" has been adopted for describing the structures of a cell and the chemical reactions inside a cell. This model has the following features.

Please note that the concept of a substance (Substance) includes not only chemical molecules, ions, and radicals, but also voluntary physical properties such as osmotic pressure and cell volume. Negative values however cannot be described.
In E-CELL, it is assumed that the intracellular concentration of a substance is uniform throughout the cell. To handle diffusion, it is therefore necessary to prepare multiple systems each with varying substance quantities.
To simulate various intracellular phenomena in E-CELL, both rate(flux)-based reactions such as enzymatic reactions, and rapid reactions such as chemical equilibrium can be implemented.
Flux-based (i.e. can be solved as differential equations) chemical reactions are handled inside E-CELL as follows.
From the standpoint of software engineering, E-CELL2 has the following features. The part written in C++ will be described first. This part, the so-called heart of E-Cell2, corresponds to the view of the world (Ontology) that shows how E-CELL2 describes a cell. Such components are called "classes" in the field of object-oriented modeling. The computation mechanisms necessary for simulation are implemented by the interactions between the classes.

The differences between E-CELL2 and the Linux-based E-CELL1 are listed below.
These changes were made to improve the portability of E-CELL1, which only works on Linux. The GUI (Graphic User Interface) and the modules for interpreting the script files for automating the operation of E-CELL2 are written in Java.
In E-CELL2, there is a GUI mode that allows for interactive operation, and a batch mode that supports command-line execution. This chapter provides explanations for only the former mode(GUI mode). Please refer to Chapter 3 Section 2.9 "Batch mode and Logger", for explanations on the latter mode(batch mode). Please note that the accuracy of the GUI mode and that of the batch mode is 64 bits and 80 bits, respectively. The inferior accuracy of the GUI mode is due to the limitations in numerical computation that exist in the Java Native Interface (JNI).
E-CELL2 will be operated here using an actual model. In this section, a metabolic model of the Human erythrocyte will be simulated using E-CELL2. Why is an erythrocyte suitable as a target of simulation? The answers to this question are as follows.
The main metabolic pathways of an erythrocyte consist of glycolysis, pentose phosphate cycle, and nucleotide synthesis. In addition, large amounts of oxygen-carrying hemoglobin exist in an erythrocyte. An erythrocyte cell can therefore be likened to a bag full of hemoglobin that has self-regulating functions based on these metabolic pathways. Although this model aims at the reconstruction of only the metabolic pathways, it is expected that hemoglobin transport will be included in a future model.

This metabolic model of the Human erythrocyte cell was constructed by assistant professor Nakayama, professor Tomita, and their colleagues at Keio University. Although only the metabolic model of a normal human erythrocyte is introduced in this demonstration, models of anemia caused by genetic disorders are also currently being simulated. Please contact assistant professor Nakayama (ynakayam@sfc.keio.ac.jp) for further information.
To observe an actual simulation of the erythrocyte cell, please select [Program]-[E-CELL2]-[erythrocyte] from [Start], or click on the icon in your desktop.
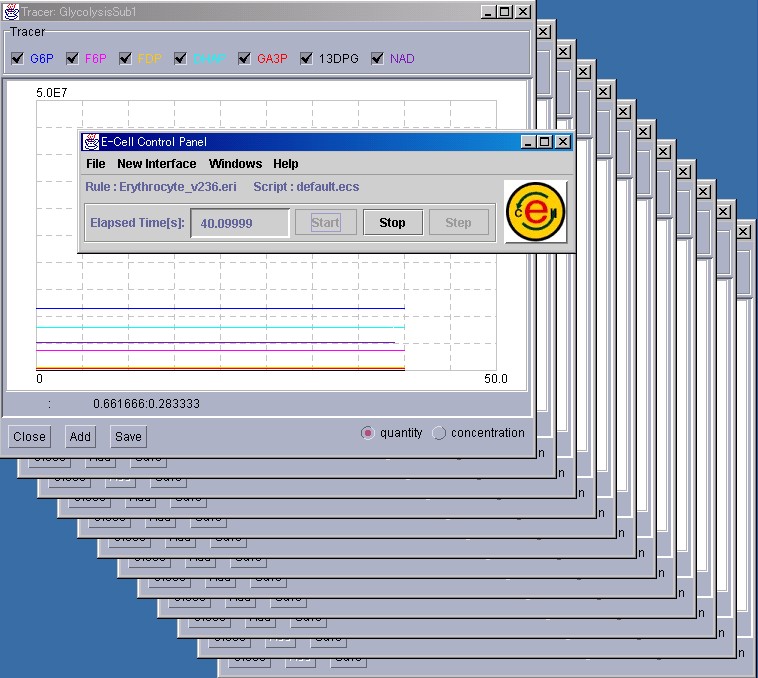
E-CELL2, loaded with the erythrocyte model, will start. If E-CELL2 finds the file "default.ecs" in the same directory as ECELL2.BAT, it reads the file(default.ecs) and attempts to start simulation. Because a default.ecs file has already been prepared for the erythrocyte model shown in Fig. 4, the demonstration will automatically start. The file "Erythrocyte_v236.eri" describes the parameters and initial values for this simulation.
Files with the ".ecs" extension usually are scripts for automating E-CELL2, and include instructions for operating E-CELL2. For details, please refer to Section 2.3 and Section 3.4. The simulation of the erythrocyte model shown in Fig. 4 will start by executing this script. Using this script, simulation would stop after 500 seconds.
To terminate E-CELL2 before the script stops the simulation, please press the "Stop" button in the Control Panel, and then select [Quit] from the [File] menu.
In the next section, the operating procedure for E-CELL2 will be briefly explained. After understanding the basic operation procedure, please reload E-CELL2 and experiment with it.
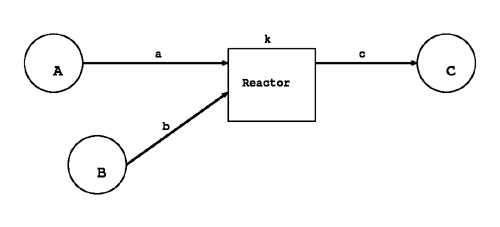
Before going into the details, a simple simulation model will be introduced. The figure below illustrates the so-called "Toy" model, which includes a simple feedback system.

5 "S"ubstrates, 4 "E"nzymes, and 1 "C"omplex constitute the model. The Substrates are interconnected via 4 Reactors (chemical reaction equations). Reactors embody chemical reaction equations, such as those based on the Michaelis-Menten scheme. In the case of a cultured cell, these reactions would exist inside a Cell, surrounded by culture medium called Environment. A Membrane compartmentalizes the external world and the cell interior, which is filled with Cytoplasm.
The network of chemical reactions has now been depicted as static graph.
However, to actually start simulation, the rules that define the parameters for each reaction(e.g. initial values, rates),and how the reactions proceed(i.e. which chemical reaction equations to choose), have to be decided.
When creating models for E-CELL, simulation rules called Rule Files, which are distinguished by the ".er" extension, are described using text editors. Then, using tools included with E-CELL, files that can be directly read by E-CELL called Rule Intermediate Files are created. Rule Intermediate Files are usually distinguished by the ".eri" extension.
Because it is difficult for beginners of E-CELL to describe Rule Files from scratch, tools for creating Rule Files from spreadsheet files are also provided to support the Rule File creation process.
Here, the methods for creating spreadsheets for simulation, and converting them to Rule Intermediate Files for E-CELL2 will be outlined.
The minimum operating procedures necessary for creating Rule Files using the modeling launcher, which is included with E-CELL2, will be explained.
To start the modeling launcher, please select [Program]-[E-CELL2]-[ModelingLauncher] from [Start], or click on the icon in your desktop.
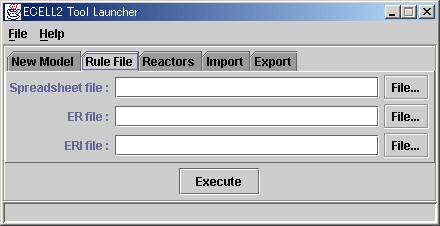
Please try loading the sample Rule File for E-CELL2. Please click on the File.. button in the Spreadsheet file column, select Edit, and open the file selection window. Then, please search and load "sample.txt".
After finishing editing, please save the file by choosing [Save] or [Save As] from the [File] menu.
The procedures for converting spreadsheets into Rule Files and Rule Files into Rule Intermediate Files will be explained. Please refer to Chapter 4 for details regarding Rule Files.
Please start the modeling launcher and load "sample.txt " and "toy.txt ". The file "toy.txt " is an incomplete spreadsheet file for the Toy model. These files are located in the tutorial-related "standard" directory.
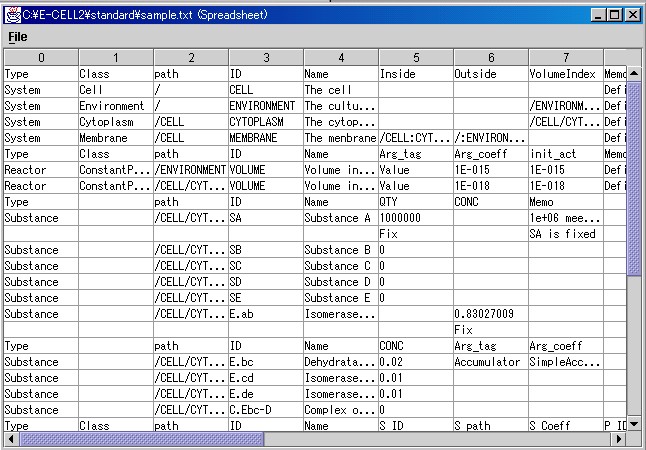
It has already been explained that "Systems", "Substances", and "Reactors" exist in the Substance-Reactor model of E-CELL. The leftmost column in the spreadsheet is called Type. Each field will include one of the above Types. Systems are used to show the structures of a cell or the localization of substances. Systems usually include "Environment", "Cell", "Membrane", and "Cytoplasm". Please refer to Section 4.2.2 for details regarding Systems. Please keep in mind here that embedded structures such as cells can be described by distinguishing "Inside" from "Outside".
A Substance implies a broad definition of a substance. The spreadsheet includes a description similar to the table shown below. In the "Toy" model, Substances are the materials undergoing chemical reactions and the enzymes catalyzing the reactions.
Table 2.1 Example descriptions of Substances used as materials for chemical reactions
| Type | path | ID | Name | QTY |
|---|---|---|---|---|
| Substance | /CELL/CYTOPLASM | SA | Substance A | 1000 |
| FIX | ||||
| Substance | /CELL/CYTOPLASM | SB | Substance B | 0 |
| Substance | /CELL/CYTOPLASM | SC | Substance C | 0 |
Path is the location of the Substance. It is described in a fashion similar to the directory path in UNIX. ID is the ID of the specified Substance, and is an essential item. Name is the name of the specified Substance. Either the Qty or the Conc for a Substance has to described. Qty is the initial "Quantity" value of the Substance, whereas Conc is the initial "Concentration" value of the Substance. The unit of Conc is mol/l. If the Quantity and Conc should not change during simulation, the values may be fixed by adding a "Fix" tag to the row right beneath. Please refer to Section 4.2.3 for details regarding Substances.
The following are descriptions regarding enzymes.
Table 2.2 Example descriptions of Substances that catalyze reactions as enzymes
| Type | path | ID | Name | CONC |
|---|---|---|---|---|
| Substance | /CELL/CYTOPLASM | E.bc | Enzyme B | 0.02 |
| Substance | /CELL/CYTOPLASM | E.cd | Enzyme C | 0.01 |
| Substance | /CELL/CYTOPLASM | C.E.bc-SD | Complex of E.bc and SD | 0 |
<Problems>
Reactors on the other hand are implemented chemical reactions. An example is defined below.
Table 2.3 Example descriptions of Reactors
| Type | Class | path | ID | Name | S_ID | S_path | S_coeff | P_ID | P_path | P_coeff | C_ID | C_path | Arg_tag | Arg_coeff |
|---|---|---|---|---|---|---|---|---|---|---|---|---|---|---|
| Reactor | MichaelisUniUniReactor | /CELL/CYTOPLASM | E.ab-0 | A->B | SA | /CELL/CYTOPLASM | 1 | SB | /CELL/CYTOPLASM | 1 | E.ab | /CELL/CYTOPLASM | KmS | 10 |
| KcF | 5 | |||||||||||||
| Reactor | MichaelisUniUniReactor | /CELL/CYTOPLASM | E.bc-0 | B->C | SB | /CELL/CYTOPLASM | 1 | SC | /CELL/CYTOPLASM | 1 | E.bc | /CELL/CYTOPLASM | KmS | 0.1 |
| KcF | 3 | |||||||||||||
| Reactor | MichaelisUniUniReactor | /CELL/CYTOPLASM | E.cd-0 | C->D | SC | /CELL/CYTOPLASM | 1 | SD | /CELL/CYTOPLASM | 1 | E.cd | /CELL/CYTOPLASM | KmS | 0.1 |
| KcF | 2 |
Path is the location of the Reactor. It is described in a fashion similar to the directory path in UNIX. S_ID is the "Substrate", or the starting substance of the chemical reaction. S_Path is its location. P_ID is the "Product", or the resulting substance of the chemical reaction. P_Path is its location. C_ID is the "Catalyst", or the chemical substance that promotes or represses the reaction. C_Path is its location. In the Arg_tag column, the constant names that are defined differently according to the type of Reactor are inputted. In the Arg_coeff column, the constant values that correspond to the Arg_tag are inputted.
Reactors whose IDs begin with "!" are back door Reactors, used for describing reactions that cannot be described by differential equations. In the "Toy" model, "!EQ-Ebc-D" is the algebraic equation-based back door Reactor. Ebc+SD < - > C.Ebc-D is a reversible reaction that consists of a reaction that produces C.Ebc-D from Ebc and SD, and a reaction that decomposes C.Ebc-D. Therefore, it cannot be solved by differential equations. Thus, "RapidEquibriumPReactor" for rapid equilibrium is used here.
<Problems>
1. Please complete the descriptions for the reaction in Reactor D->E.
Please refer to Section 4.2.4 for details regarding Reactors. If all of the above operations have been finished, please save "toy.txt", and start working on creating Rule Files.
The actual operations for creating Rule Files from spreadsheet files will be explained using the model launcher.
Please click on the "File..." button in the spreadsheet file column, and then open the file selection window by selecting "Choose...". Please search and load "toy.txt".

If the Execute button is clicked, a Rule File "toy.er" and a Rule Intermediate File "toy.eri" will be created.
The creation of Rule Files and Rule Intermediate Files have been explained in this section. Please proceed to the next section on creating Reactors.
To describe a chemical reaction that is not included in the standard reactors, one must design and create a Reactor for E-CELL2.
RD files are created by arranging lines consisting of pairs of keywords and values.
RD files can roughly be divided into the following three parts;When creating Reactor Description files, please conform to the following rules.
An example RD file is shown below.
| v = | KcF[E][S] | |
|
||
| KmS + [S] |
The file for the MichaelisUniUniReactor
@CLASSNAME:MichaelisUniUniReactor

@BASECLASS: FluxReactor
@AUTHOR: E-CECLL Tutorial
@EMAIL: tutorial@e-cell.org
@DATE: 2000 12/12

%VERSION: ecs-v1, 0.1

@BRIEF_DESCRIPTION:Unireactor enzyme activity of which kinetics can be described by the Henri-Michaelis-Menten equation.

@DESCRIPTION:A reactor class for unireactant enzyme activity where kinetics can be described
by the Henri-Michaelis-Menten equation derived from rapid equilibrium assumptions.
\vspace{0.2cm}

This reactor is applicable to the following reaction sequence:

\begin{center}
$E+S \rightleftharpoons ^{k_{1}}_{k_{-1}}ES
\rightarrow^{k_{p}}E+PS
\end{center}
\vspace{0.3cm}

@EQUATION:$$v=\frac{(K_{cF}[E] [S]}{K_{mS}+[S]}$$

%SUBSTANCE:Substrate, 1, 1
%SUBSTANCE:Product, 1, 1
%SUBSTANCE:Catalyst, 1, 1
%SUBSTANCE:Effector, 0, 0

%PARAMETER: KmS, Float, mol/l, Michaelis Constant of Substrate
%PARAMETER: KcF, Float, mol/l, Catalytic Constant (Forward)

@REACT_FUNC:
Float S = substrate(0)->concentration();
Float E = catalyst(0)->quantity();

Float velocity = KcF * E * S;
Float Den = KmS + S;

velocity /= Den;
process(velocity);
Reactors have been briefly explained in this section. Please refer to Chapter 5 for details regarding Reactors.
A simple example will be given to explain how to create Reactors.
Please start the modeling launcher, and then click on the Reactor tab. Please click on the "File.." button in the RD file column, then select "Edit.." and open the file selection window.
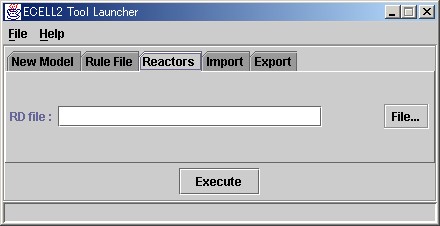
Please open the file "MyMichaelisMentenUniUni.rd". Reactor Description files(RD files) are usually created as files with the ".rd" extension. Reactors are defined and described in these files.

When creating Reactor Description files, please note that the file name minus the .extension has to directly become @CLASSNAME, as shown for this file. Except for their class names, the contents of MyMichaelisUniUniReactor.rd and MichaelisMentenUniUniReactor.rd are identical. The description files for the standard reactors would be located in "C:\E-CELL2\standard \RD" in a standard installation. When creating Reactor Description files, it would probably be helpful if the descriptions in these files are used for reference.
By using the modeling launcher to create C++ source codes and header files from Reactor Description files, and then by compiling them, Reactor DLLs are created. Please press the "Execute" button to create the DLL.
If there are no syntax errors in the C++ code for the RD file, and if the Borland C++ Compiler has been properly set, a DLL will be created. Messages will be displayed in the message window during the compilation process.

After the compilation process has finished, "MyMichaelisMentenUniUniReactor" will actually be used. Please open "toy.txt" using the modeling launcher.
Please replace "MichaelisMentenUniUniReactor" with "MyMichaelisMentenUniUniReactor", then save the file, and press the "Execute" button.
Please start E-CELL2, then load "toy.eri" by selecting [Load Rule] from the [File] menu, and begin simulation. If the behavior is the same as that of "sample.eri", the Reactor has been successfully created.
Please continue working on Reactors so that in the future, you will be able to design and create new Reactors necessary for executing your own simulation model.
The goal of this section is to master the basic operation of E-CELL2, using the Rule Intermediate Files and Reactors that have been created. A Control Panel will first appear when E-CELL2 is started.
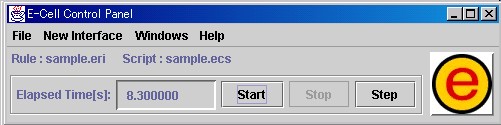
The pull-down menus will be explained first.

The items [Load Rule], [Load Script], [Load Cell State], [Save Cell State] and [Quit] are included in the [File] menu.
[Load Rule] is selected when loading Rule Intermediate Files.
[Load Script] is selected when loading scripts for automating the operation of E-CELL2.
[Load Cell State] is selected when resuming simulation by loading files that include the progress data of a cell state.
[Save Cell State] is selected when saving files that record the progress data of a cell state.
[Quit] is selected when terminating E-CELL2.
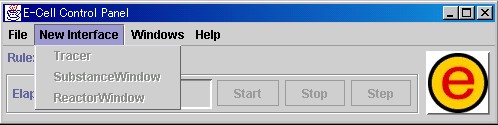
The items [Tracer], [SubstanceWindow], and [ReactorWindow] are included in the [New Interface] menu.
[Tracer] is selected when creating a [Tracer] window, which represents the quantity of Substances or the activity of Reactors.
[SubstanceWindow] is selected when opening windows for displaying and manipulating Substances.
[ReactorWindow] is selected when opening windows for displaying Reactors.
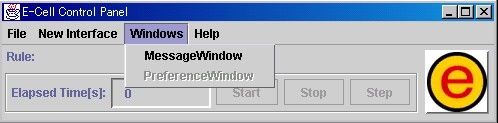
The items [MessageWindow] and [PreferenceWindow] are included in the [Windows] menu.
[MessageWindow] is used when opening windows for displaying messages from E-CELL2.
[PreferenceWindow] is selected when setting the width of a simulation time step and the timing of [Tracer] window updating.

The item [Version Information] is included in the [Help] menu. If selected, the version information will be displayed.
The menus have been explained above.
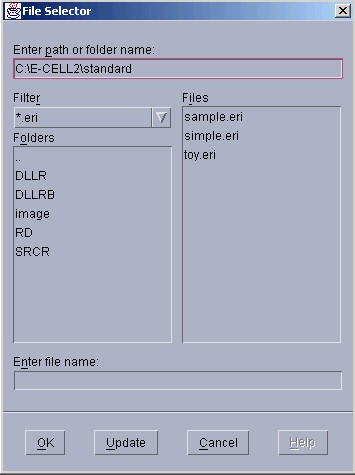
To load Rule Intermediate Files, please select [File]menu-[Load Rule]. A file selection window will be displayed. Please click on the name of the file that ends with the ".eri" extension, which indicates that it is a Rule Intermediate File, then select " Open ".
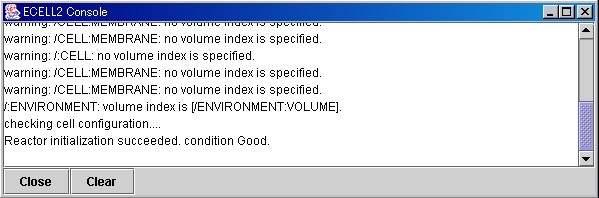
If the designated file is loaded normally, "Condition Good." will be displayed in the Message Window.
Next, please prepare for displaying the quantity of Substances as graphs. If [New Interface] - [Tracer] is selected, a Tracer will be displayed.

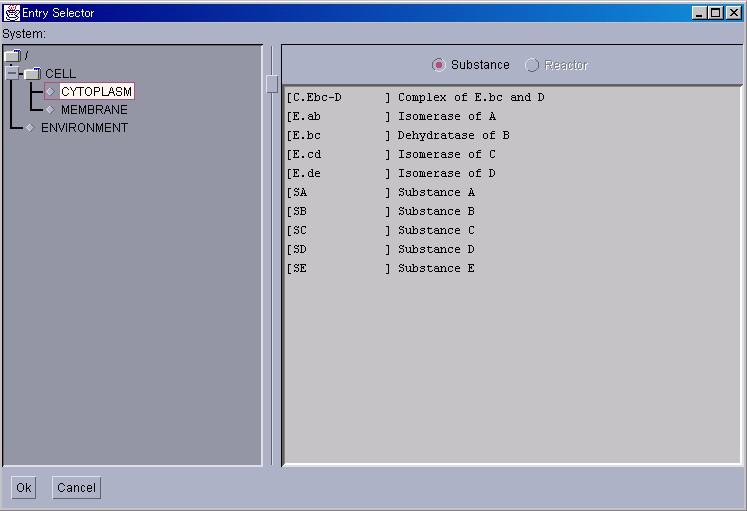
Please press the " Add " button in the lower left corner of the Tracer to display an [Entry Selector] window. Please click on the left panel, and select a Substance that is located in the Cytoplasm.
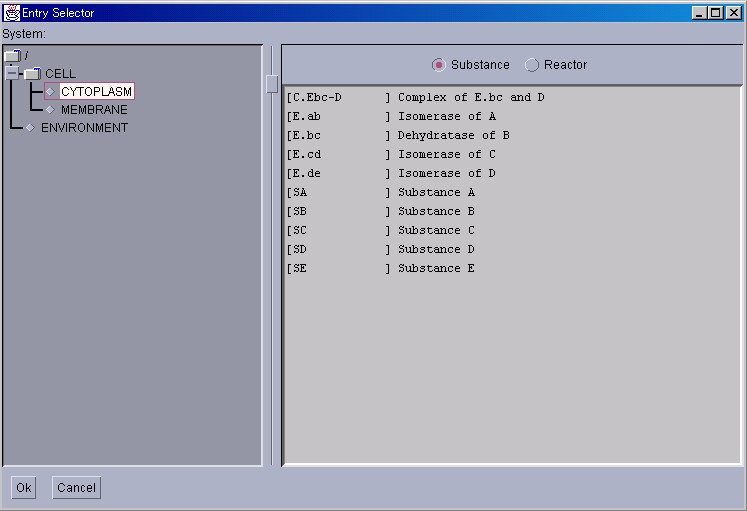
Please click on the Substance radio button to display the Substances on the right panel. Reactors can be similarly displayed.
The method for choosing two or more Substances or Reactors will now be explained. To select several entries, please click on the left mouse button while pressing the "Shift" key. After selection, please press the "Ok" button. Simulation can now be started by pressing "Start" in the Control Panel.
Up to 8 Substances or Reactors can be displayed on a single Tracer.
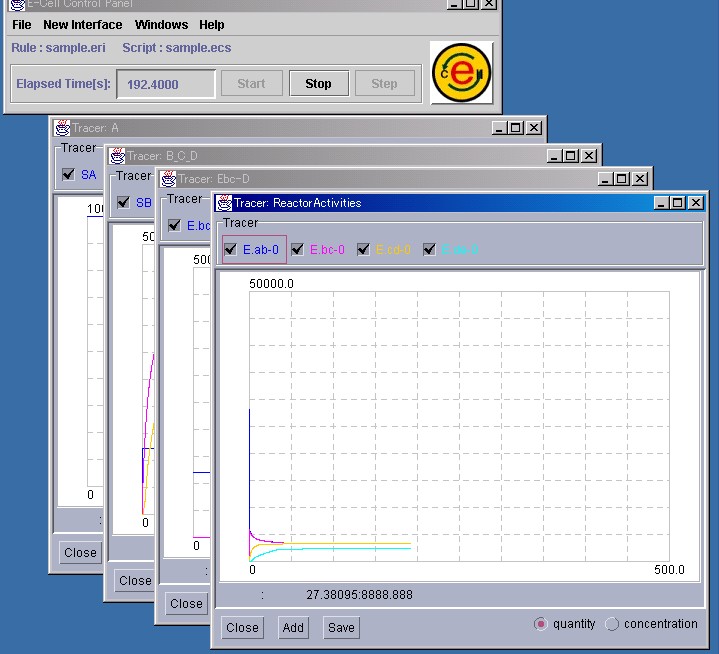
Based on the rules, the quantity of Substances or the activity of Reactors will be displayed in the Tracer. The simulation results displayed in the Tracer can be saved by pressing the "Save" button in the Tracer. Please refer to Section 3.2.7 for details.
The quantity of Substances can be changed manually to observe how the whole system is affected by such changes. Please select [Substance Window] from the [New Interface] menu.
Because this Entry Selector is only for Substances, Reactors cannot be selected. If a Substance is selected and then the "Ok" button is pressed, a window displaying the individual details of the selected Substance will appear.
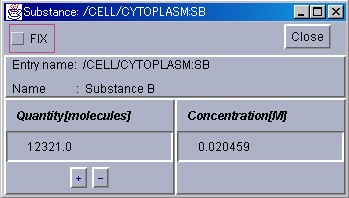
The quantity of the designated Substance can be forced to increase or decrease by pressing the "+" and "-" buttons respectively, or by inputting a value in the "Quantity" or "Concentration" text field. If the "Fix" check button is checked, the quantity of the Substance can be made to ignore the computation results and maintain at a constant value. To terminate operation of the SubstanceWindow, please press the "Close" button.
Please try changing the quantity of a Substance, and then observe its effects on the system.
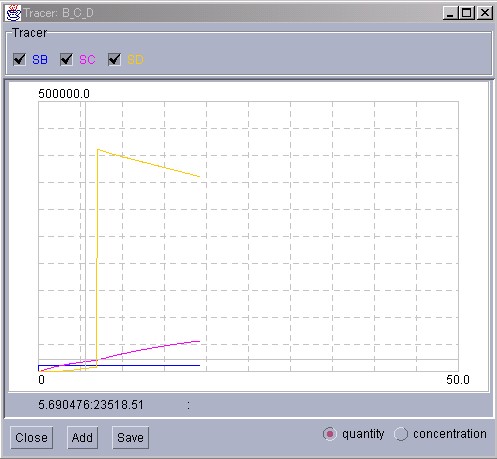
In this example, "Substance D" has been suddenly increased. It can be observed that the increased Substance, compensated by the other reactions in the system, gradually decreases.
Similarly, the activity of Reactors can also be displayed in detail. Please select [ReactorWindow] from the [NewInterface] menu in the Control Panel.
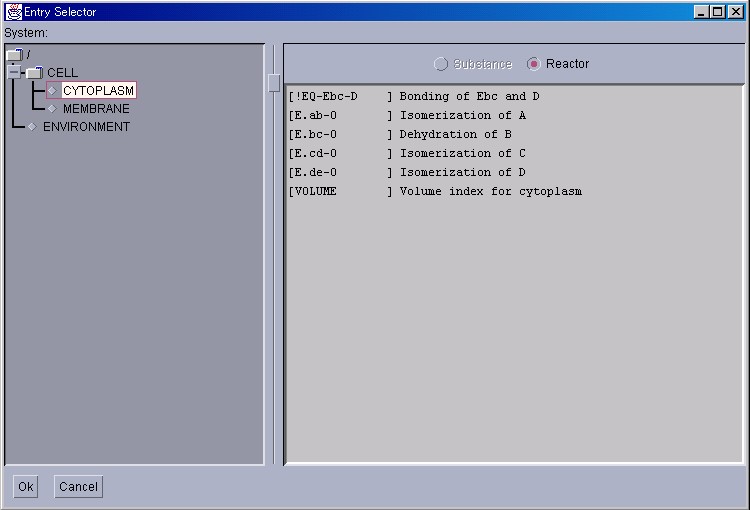
As was the case with SubstanceWindow, please click on the System displayed in the left panel, and search for the target Reactors. Please click on the "Ok" button after selecting the Reactors.
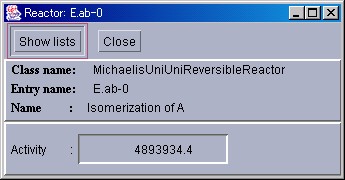
In this window, the name of the selected Reactor, the type of reaction equation used, and the activity of the reaction is displayed. If the "Show lists" button is pressed, more details will be displayed. If the "Close" button is pressed, the window will close.
Please try pressing the "Show lists" button.
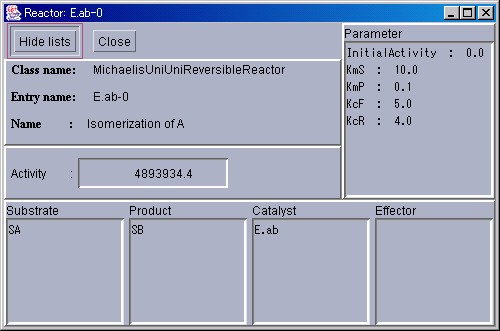
Besides the information above, the initial values for each parameter and information regarding the substances participating in the reaction will be displayed. To return the window to the original size, please press the "Hide lists" button. To close the window, please press the "Close" button.
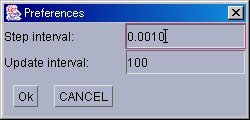
PreferenceWindow will be explained next. To display this window, please select [PreferenceWindow] from the [Windows] menu in the Control Panel. This window is provided to control the width of a simulation time step(Unit:sec.), and how often the Tracer window is updated. If the time step is short, the accuracy of computation increases at the expense of increases in the time necessary for simulation. On the other hand, if the time step is long, the time necessary for simulation decreases but the accuracy of computation also decreases which therefore makes its results less reliable. In the initial settings, a computation step is set at 0.001 seconds, whereas the frequency of window updating is set at once per 100 steps.
Because this window is a modal dialog, other windows may not be operated until "Ok" or "CANCEL" is pressed.
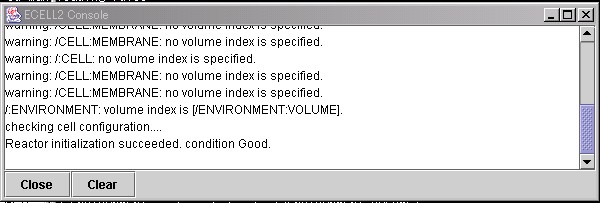
In the MessageWindow, messages from E-CELL2 will be displayed. To close this window, please press the "Close" button. If the "Clear" button is pressed, the messages displayed in the window will be cleared.
[Version Information] can be selected from the [Help] menu in the Control Panel. The version information for E-CELL2 will be displayed here.

Also, if [Model Information] is selected from the [Help] menu in the Control Panel, a description of the models will be displayed on a browser.
At the end of this section, the methods for saving simulation states will be explained. To save the progress of simulation, please press the "Stop" button in the Control Panel, and then select [Save Cell State] from the [File] menu.

Files describing the state of the whole cell model have the ".cs" extension. Please save it under a suitable directory. Files in this format can be loaded by selecting [Load Cell State] from the [File] menu in the Control Panel. It is thus possible for simulation to be resumed from a saved state.
In large-scale simulation, the manual operation of its various tasks is a troublesome process. In E-CELL, simulation can be automated by using a mechanism called "script", which loads the commands described in the script into E-CELL. Script files are usually distinguished by the ".ecs" extension.
The directions on how to write the script files will be explained briefly here. The format differences between the script files of E-CELL1 and E-CELL2 will also be explained.
First, please take a look at the following file(The numbers in the beginning of each line are line numbers).
01  TmpDir C:\E-CELL2\temp
02  LoadRule sample.eri
03
04  NewInterface Tracer A_B_C
05    AddTrace    Substance:/CELL/CYTOPLASM:SA
06    AddTrace    Substance:/CELL/CYTOPLASM:SB
07    AddTrace    Substance:/CELL/CYTOPLASM:SC
08    SaveAt      500
09
10  UpdateInterval 100
11
12  Run 501
13  SaveCellState sample-after500s.cs
14  Stop
  Line 1: Designates the directory for saving temporary files.
TmpDir is a directory for saving temporary files.
If the command does not exist, the "temp" directory under E-CELL2's installation directory is used.

  Line 2: Designates the Rule Intermediate File (".eri" file) to be loaded.

  Line 4-8: Information regarding a Tracer
  Line 4-7: "AddTrace" is declared only inside a Tracer.

         The Substances or Reactors written in the arguments are added for display by the Tracer.

         The arguments must include not only the ID, but also the System and Type that it belongs to.
  Line 8: The Substances displayed in this Tracer are saved after 500 seconds in E-CELL time.

          It is declared only inside a Tracer.
  Line 9: A blank line is necessary after a NewInterface.
  Line 10: Updates the Tracer every 100 steps.
  Line 12: Executes simulation for 501 seconds.
 Line 13: Saves the state of the cell model to the file "sample-after500s.cs".

 Line 14: Stops the simulation.
Please save the file above with a suitable name such as "toy.ecs". (However, please do not use non-US ASCII characters). Please save it under the directory "C:\E-CELL2\standard", which is the directory that includes "sample.eri". If E-CELL2 has been installed under a directory other than this, please choose the proper target directory accordingly.
Please start the standard reactor-version of E-CELL2. After it starts, please select [Load Script] from the [File] menu in the Control Panel, and load the .ecs file that has just been created.
The "Logger" mechanism, which has been newly implemented for E-CELL2, will also be introduced here. Logger is a mechanism that continuously records the states of a cell. It is more advanced than saving the cell states in a snapshot manner. It can be used by adding the following descriptions to the script file.
NewInterface Logger test-log
  AddTrace    Substance:/CELL/CYTOPLASM:SA
  AddTrace    Substance:/CELL/CYTOPLASM:SB
  AddTrace    Substance:/CELL/CYTOPLASM:SC
  AddTrace    Substance:/CELL/CYTOPLASM:SD
  AddTrace    Substance:/CELL/CYTOPLASM:E.bc
  AddTrace    Substance:/CELL/CYTOPLASM:C.Ebc-D
  AddTrace    Reactor:/CELL/CYTOPLASM:E.ab-0
  AddTrace    Reactor:/CELL/CYTOPLASM:E.bc-0
  AddTrace    Reactor:/CELL/CYTOPLASM:E.cd-0
Please add the descriptions regarding the Logger after the 9th line in the ".ecs" file that was first created, and load it to E-CELL2.
Loggers have the following features.
After simulation stops, please try opening the .ecd file located under the Logger directory using tools such as notepads. The file names correspond to each Substance and Reactor. Information on the "time", "instantaneous value", "average value", "maximum value", "minimum value", "instantaneous concentration", "average concentration", "maximum concentration", and "minimum concentration" are listed.
The procedures for carrying out simulation have been explained so far in this chapter. Please refer to the chapters that follow Chapter 3 for details regarding each item.
| E-CELL2 User's Manual Last Update $Date: 2003/3/25 $. Copyright: Keio University and Mitsui Knowledge Industry Co., Ltd. 2000-2003 | Chapter 2 Tutorial [Chapter 1Chapter 3:Chapter 4:Chapter 5:Chapter 6][Top] |